NARRATIVE
POLICE STOPS ARE MOST LIKELY TO HAPPEN ON WEDNESDAYS AND DURING THE NIGHT.
First, we aimed to investigate how temporal and weekly patterns of police stops reflect broader systemic dynamics, including potential biases in law enforcement practices. Policing is shaped by historical and institutional contexts. Research has shown that structural factors, such as urban planning, socioeconomic disparities, and systemic racism, can influence where, when, and how police activity is concentrated. In San Francisco, as in many urban centers, traffic stops are a common site of interaction between citizens and law enforcement and can raise questions about the equity and effectiveness of these encounters.

Figure 1, “Police Stops by Time of Day,” illustrates how the frequency of stops varies throughout a 24-hour period. By utilizing Python, we found that stops are most frequent around midnight and during the late afternoon and evening (17:00–19:00), with a significant dip during the early morning hours (03:00–05:00). This pattern likely reflects a combination of increased public activity during peak commuting hours and targeted enforcement during times associated with social events, such as late-night gatherings.
The observed trends align with findings from Feigenberg and Miller (2020), which suggest that police activity is strategically concentrated during high-traffic periods to maximize law enforcement efficiency, though these patterns may also reflect implicit or explicit biases. Additionally, the “veil of darkness” hypothesis, discussed by Pierson et al. (2020), posits that the anonymity provided by darkness reduces the frequency of stops for drivers of color, potentially contributing to the drop in stops during the early morning hours.
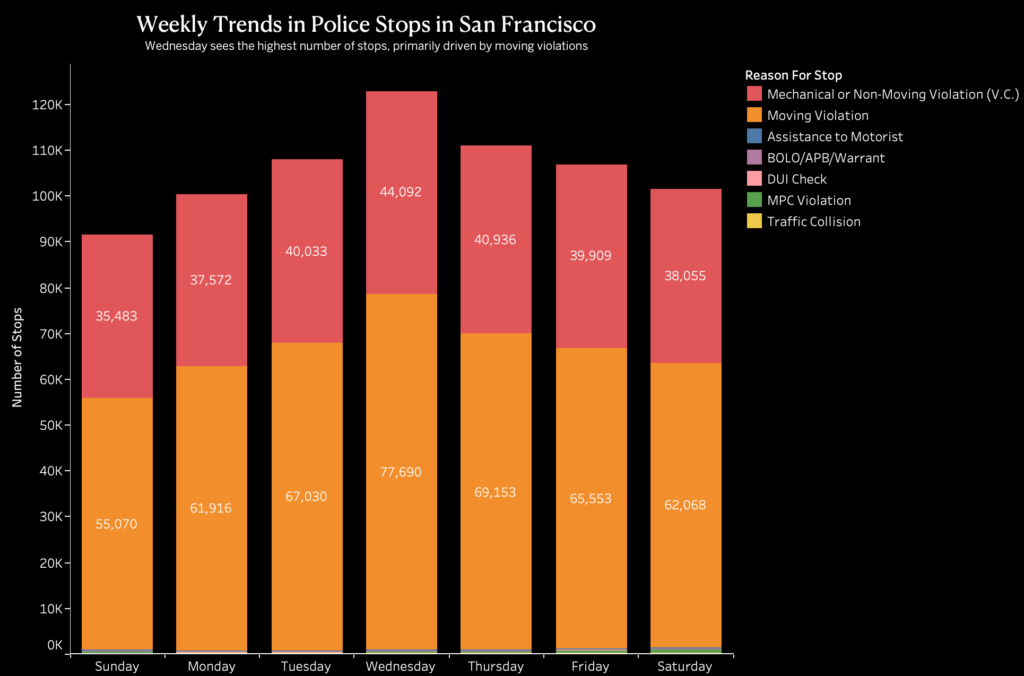
Figure 2, “Weekly Trends in Police Stops in San Francisco,” reveals fluctuations in stop frequency across the days of the week. The highest number of stops occurs on Wednesday, with activity declining from Thursday through Saturday and reaching its lowest point on Sunday. The dominant reasons for stops, including “Mechanical or Non-Moving Violations” and “DUI Checks,” suggest a focus on traffic safety and impaired driving prevention.
The mid-week peak in stops might reflect enforcement strategies targeting regular commuter traffic, while the lower numbers on weekends could be due to reduced commuting activity. This aligns with findings from Jones (2014), who highlighted how law enforcement adapts its presence to align with patterns of public activity and perceived risk.
The patterns depicted in Figures 1 and 2 point to deliberate enforcement strategies aimed at maximizing police visibility during high-activity periods. However, studies such as Goel et al. (2017) warn that relying on predictive data to inform policing practices can inadvertently perpetuate systemic biases, particularly when historical inequities are embedded in the data. Similarly, Harris (1997) cautions against the use of pretextual stops, which may disproportionately impact marginalized communities under the guise of traffic enforcement.
Figures 1 and 2 reveal significant temporal and weekly variations in police stops, shaped by both practical enforcement goals and broader systemic dynamics. While these patterns may reflect efforts to enhance public safety, they also highlight the need for continued scrutiny to ensure that enforcement practices do not reinforce existing inequities. By understanding the systemic factors driving these patterns, policymakers can work toward more equitable and effective policing strategies.
THE DEMOGRAPHICS OF TRAFFIC STOPS IN SF MIRROR THE SF POPULATION DEMOGRAPHICS.
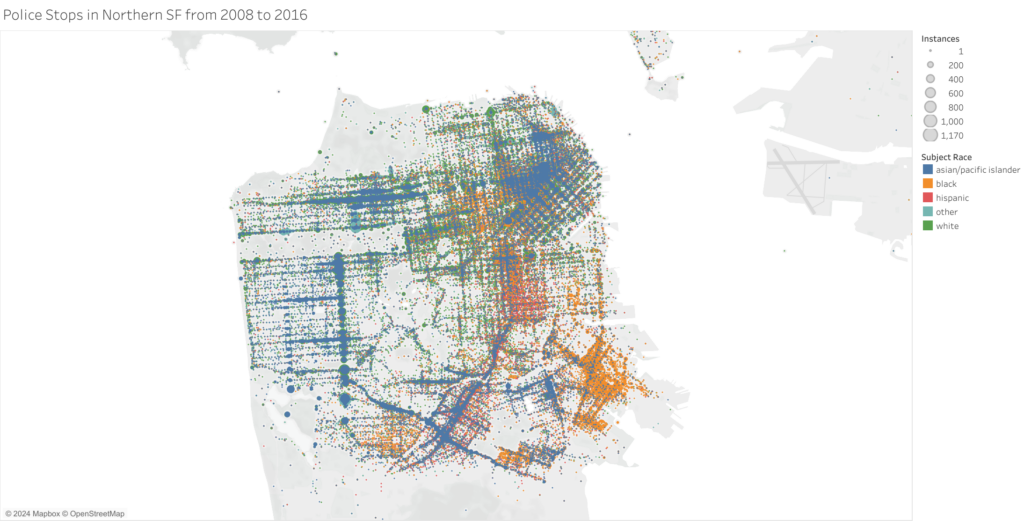
Our team created a dot distribution map, seen in Figure 3, which shows the locations of each traffic stop in northern San Francisco from 2008 to 2016. The dots range in size based on the number of stops on the specific coordinates, and the dot’s color corresponds to the race of the stopped person. Created in Tableau, this map allows viewers to identify the coordinates with the highest frequencies of stops. Certain areas of Northern San Francisco appear to be where people of certain races are stopped more frequently than others.
The Bayview area, for example, has a higher number of Black drivers stopped than other regions. Likewise, the Mission District has a larger number of Hispanic people stopped. Stops of White drivers, AAPI drivers, and drivers of different races seem to be more evenly distributed across the map, while some areas – mostly parks and bridges have very few stops within them.
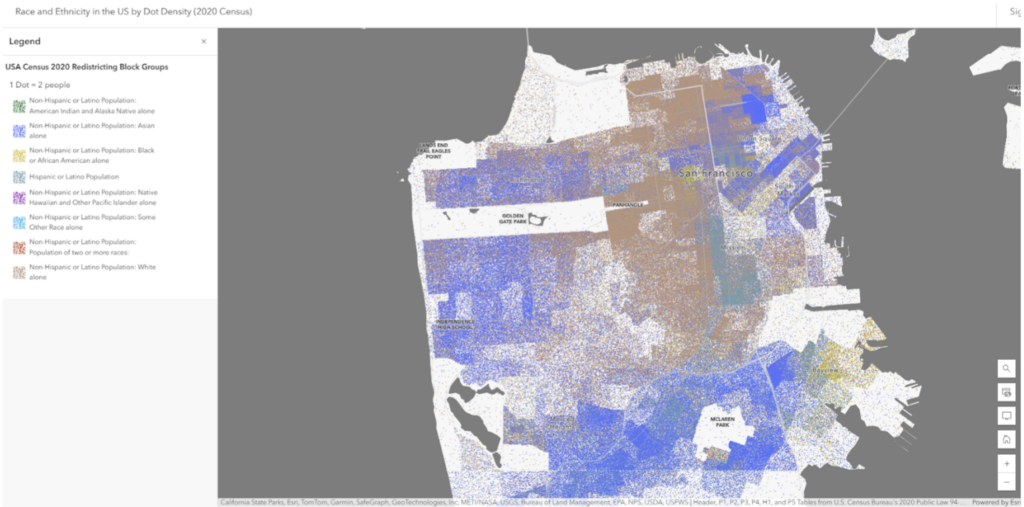
We compared our dataset map to a map representing the racial demographics of SF neighborhoods, seen in Figure 4, to explore why there are high concentrations of stops for individuals of certain racial backgrounds. Our theory was that certain regions have more individuals of a certain race, and therefore more of them are stopped – making this a matter of correlation rather than police bias. To explore this, we found a map created on ArcGIS, a web-based map builder, which draws from the 2020 US Census to create a map representing race and ethnicity in the US by dot density.
When comparing this map to the one made with our data, we can see that the race-based trends noted in our data are reflections of SF’s racial demographics. The Bayview area does have a higher population of Black citizens, reflecting the higher number of stops of Black drivers. Similarly, Mission District has a larger portion of Hispanic residents, which is likely why there are more stops of Hispanic drivers in the area. The distribution of SF traffic stops by race is very similar to the actual racial distribution of the SF population. Therefore, there does not appear to be policing biases in play with the differences in traffic stop frequency by race throughout SF.
YOUNG HISPANIC AND BLACK MALES GETS STOPPED THE MOST.
Examining who gets stopped by police unveils deep-rooted societal structures and biases that permeate law enforcement practices. This analysis focuses on the intersections of race, gender, and age, revealing patterns that reflect systemic inequities in policing. Studies like those by Pierson et al. (2020) and Kramer and Remster (2018) have documented that these disparities are not isolated but are often the result of institutional biases shaped by historical and socio-economic inequalities. By exploring demographic patterns, we aim to provide a more nuanced understanding of how these factors intersect to influence police behavior and its implications for marginalized communities.
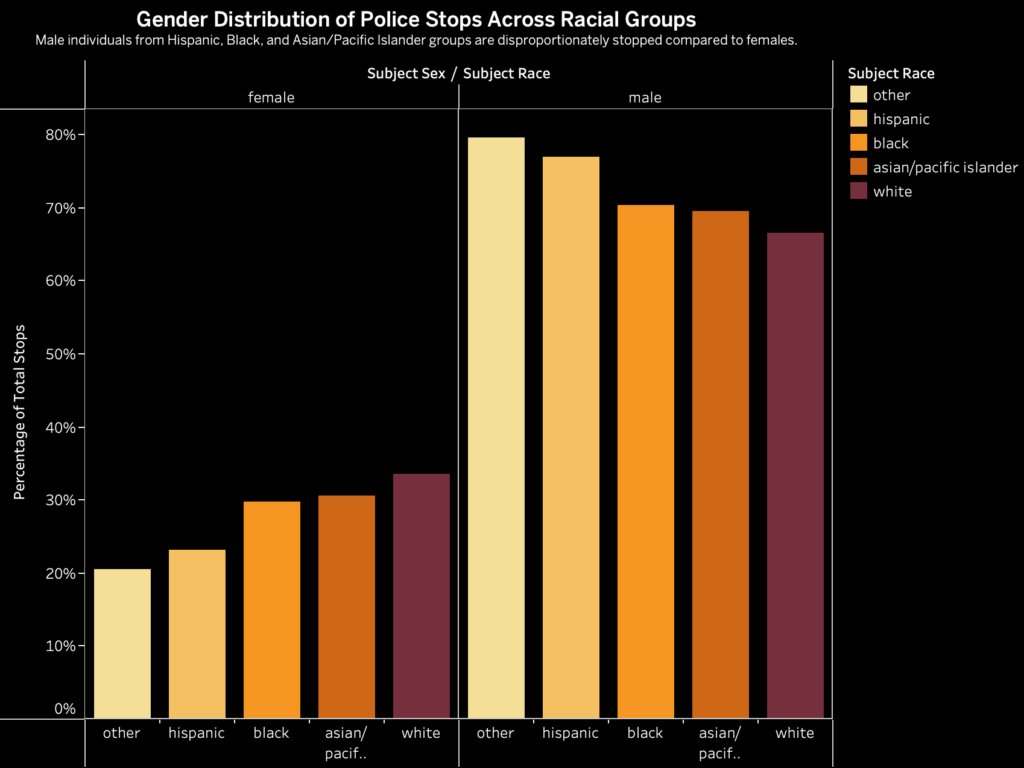
Figure 5, “Gender Distribution of Police Stops Across Racial Groups,” shows a disparity in stop rates by gender and race. Men overwhelmingly dominate police stop statistics across all racial categories, with Hispanic and Black men being disproportionately represented. Women, by contrast, account for a much smaller percentage of stops, with Asian/Pacific Islander and White women comprising the lowest proportions.
This pattern reflects broader societal stereotypes that associate criminality with men, particularly men of color. Harris (1997) describes how pretextual stops are often used disproportionately against minorities, with law enforcement justifying stops on minor violations while implicitly targeting individuals based on race and gender. The overrepresentation of Black and Hispanic men aligns with Lynch et al. (2013), who found that these groups are often profiled due to implicit biases that associate them with higher crime rates.
Furthermore, the relative underrepresentation of women, particularly Asian/Pacific Islander and White women, may stem from societal perceptions of these groups as less likely to engage in criminal behavior. While this may seem like a “positive” bias, it highlights how stereotypes influence the allocation of law enforcement resources and the experience of individuals across different demographic groups.
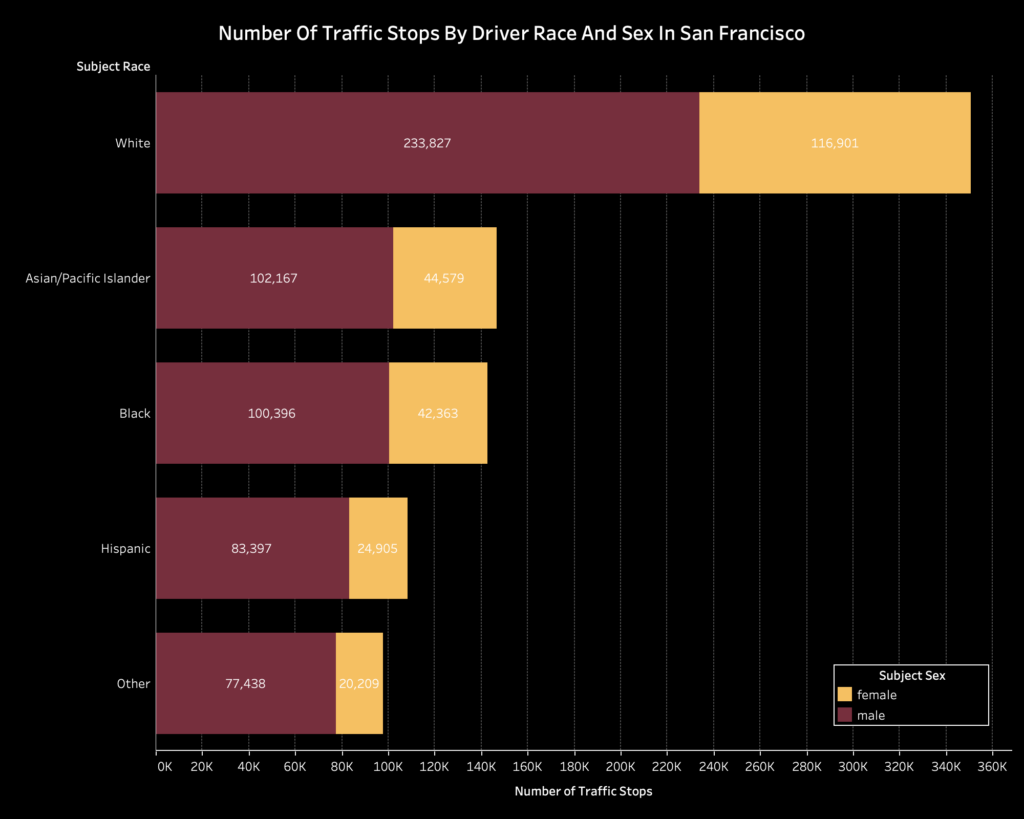
Figure 6, “Number of Traffic Stops by Driver Race and Sex in San Francisco,” provides additional insight into how race and gender intersect in police interactions. White drivers, both male and female, represent the highest absolute number of stops. However, this figure must be contextualized against the racial composition of San Francisco’s driving population to assess whether these stop rates are proportional.
Among minority groups, Black and Hispanic men stand out with significantly higher stop counts than their female counterparts. For instance:
- Hispanic males are stopped over three times as often as Hispanic females.
- Black males have a similarly disproportionate representation compared to Black females.
These disparities reinforce the narrative of systemic racial profiling, where men of color are often subjected to heightened scrutiny. The chart also highlights that, while women are stopped less frequently, their underrepresentation does not negate the potential biases and differential treatment they may face during these interactions, as documented by the Prison Policy Initiative (2019).
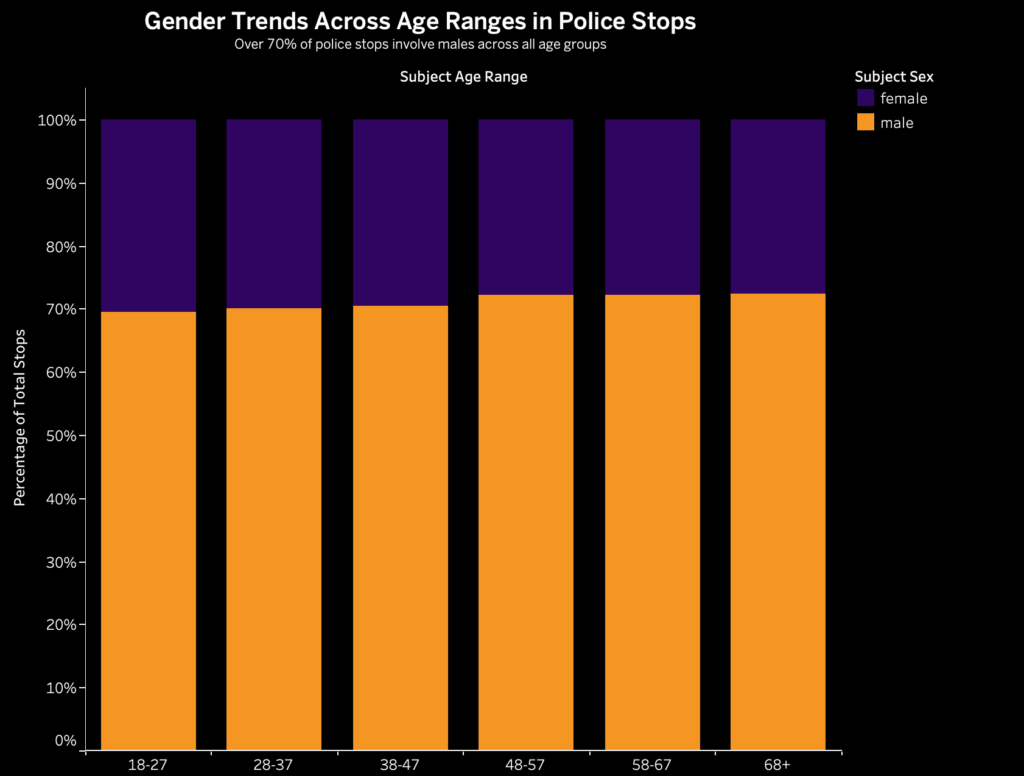
Figure 7, “Gender Trends Across Age Ranges in Police Stops,” introduces age as a critical factor in stop rates. Among men, stops peak in the 53–59 age range, which could reflect patterns of police enforcement targeting individuals perceived to be regular drivers during peak commuting hours or enforcement priorities directed at more experienced drivers. Research by Pierson et al. (2020) suggests that enforcement strategies often align with patterns of high visibility and road usage and explain the increased stops for men in this age group. For women, stops are most frequent in the 25–31 age range. Studies by Wilson et al. (2021) have shown that age-related factors, such as employment status and commuting needs, influence driving patterns such as making younger women more likely to be on the road during enforcement hours. Furthermore, implicit biases may also play a role, with women in this age group potentially being stopped more frequently due to perceptions tied to “suspicious activity” or traffic violations associated with less experienced drivers.
The intersection of age and gender in policing decisions suggests that law enforcement practices are shaped by assumptions about behavior at different life stages. For example, Wilson et al. (2021) discuss how age-based stereotypes, such as the perception of younger individuals as more prone to risk-taking or criminal behavior, can result in heightened scrutiny of these groups. The spike in stops among women aged 25–31 could also reflect a combination of demographic trends (e.g., higher rates of driving among younger women) and implicit biases about gender roles in public spaces.
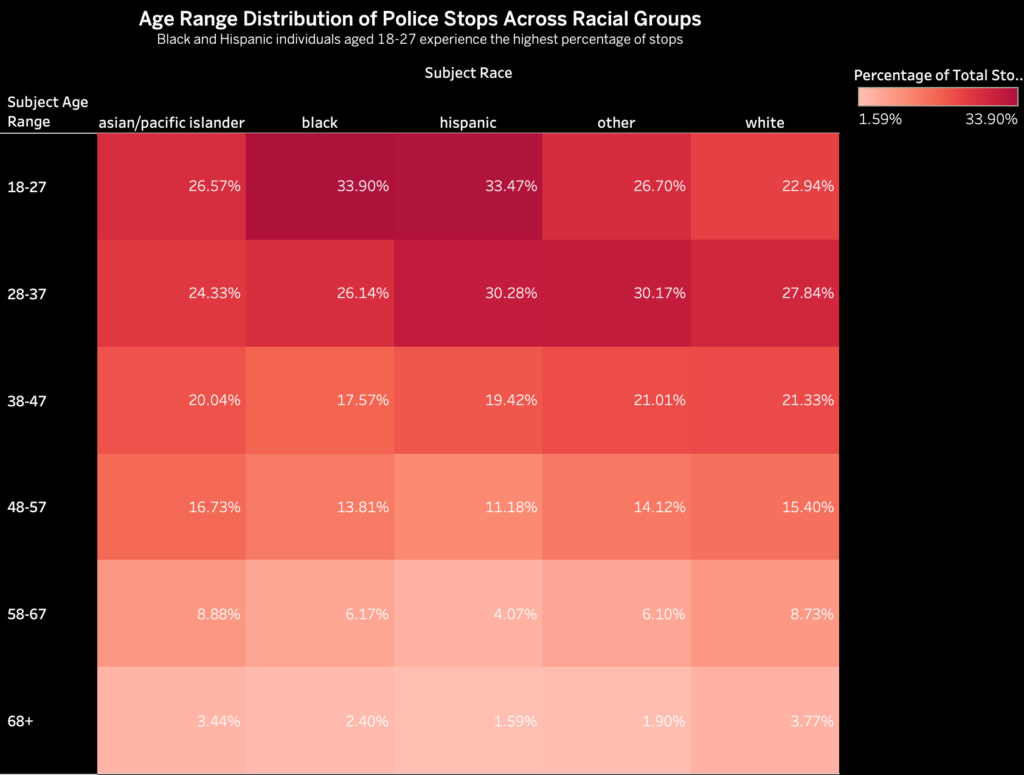
Figure 8, “Age Range Distribution of Police Stops Across Racial Groups,” provides a detailed breakdown of stop rates by age and race. Young Black and Hispanic individuals (18–27) represent the largest share of stops across all racial groups, with percentages significantly higher than those of their White and Asian/Pacific Islander counterparts. As age increases, the proportion of stops decreases consistently across all racial groups, with those aged 68 and older accounting for the smallest percentages.
This pattern reinforces findings by Tomaskovic-Devey and Warren (2009), who noted that young Black and Hispanic men are disproportionately targeted for stops, often under the justification of vague and subjective criteria like “suspicious behavior”. This over-policing of younger minority groups not only reflects stereotypes but also perpetuates systemic inequities by subjecting these individuals to increased scrutiny and criminalization.
The consistent decline in stops with age may reflect shifting enforcement priorities, as older individuals are less likely to be perceived as engaging in criminal behavior. However, this trend raises questions about how stereotypes influence law enforcement practices, particularly for young individuals of color who are disproportionately targeted despite evidence showing that they are no more likely, and often less likely, than other groups to engage in criminal activity.
The data shown across Figures 5, 6, 7, and 8 paints a clear picture of systemic biases in law enforcement. Young Black and Hispanic men are overrepresented in traffic stops, while White and Asian/Pacific Islander women are underrepresented. These disparities not only reflect broader societal dynamics but also perpetuate cycles of mistrust and criminalization for marginalized communities. For example:
- Young men of color face increased scrutiny, which can contribute to cycles of over-policing and criminal justice involvement.
- Women, though stopped less frequently, may still experience differential treatment during these interactions, as highlighted by Wilson et al. (2021)
The demographic patterns in police stops underscore the importance of addressing systemic biases in law enforcement. While some differences may be attributed to legitimate enforcement priorities, the overrepresentation of specific groups, particularly young men of color, raises critical concerns about fairness and equity. Incorporating these insights into policing reforms can help create more equitable practices and rebuild trust with marginalized communities. By understanding who gets stopped, we can take the first step toward dismantling systemic inequities in law enforcement.
BLACK AND HISPANIC DRIVERS ARE MOST LIKELY TO HAVE THEIR VEHICLES SEARCHED.
So far, we have looked at how the time and demographic patterns of traffic stops in San Francisco provide insight into specific police practices. Based on those findings, we have drawn implications into who law enforcement is likely targeting, particularly young men of color. This section aims to take one step further and study the exact outcomes of these traffic stops. The data set categorized “outcomes” into four options: warning, no further action, citation, and arrest. The likelihood of these outcomes was also influenced by whether or not a search was conducted on the vehicle. Examining the actions an officer chooses after pulling over a certain individual can provide perhaps the most insight into the role that prejudice plays in policing. By exploring these patterns, we aim to provide a greater understanding into how each demographic is treated by the police, and what these interactions mean in the larger context of social prejudice.
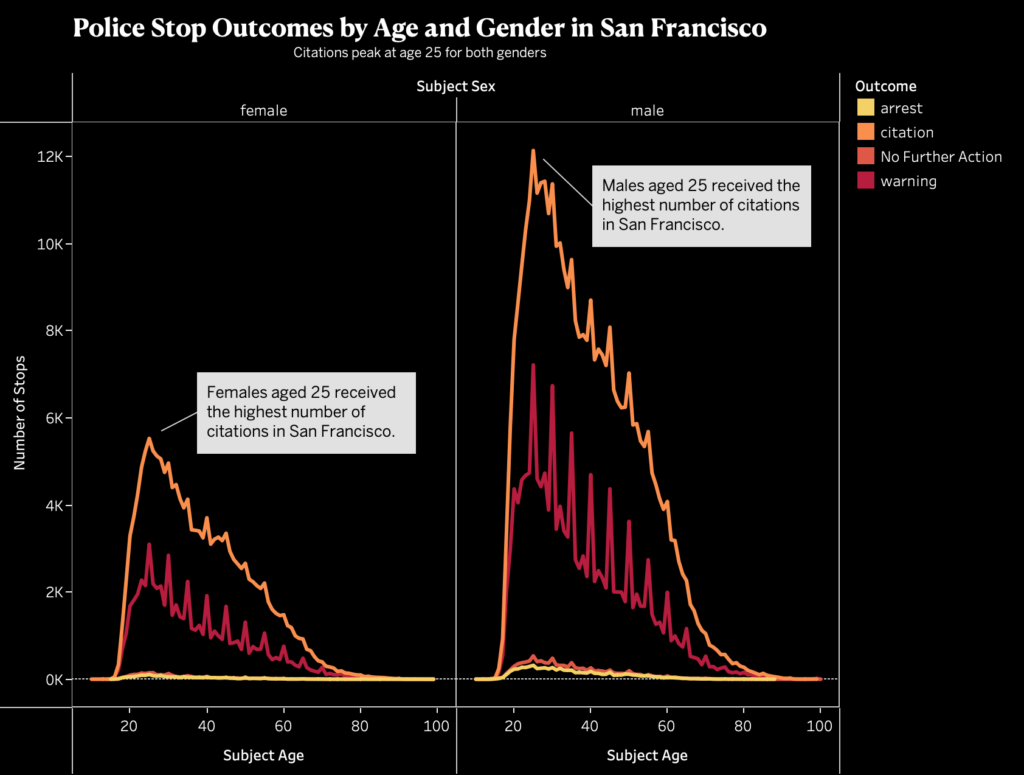
Figure 9 provides insight into the relationship between driver age, gender, and the likelihood of different police stop outcomes in San Francisco. The chart reveals that for both genders and for all ages, “citation” is the most likely outcome, followed by “warning.” The other two outcomes, “no further action” and “arrest,” are the least common and seem almost equal in frequency across ages.
This chart has two interesting patterns concerning age and gender. First, the fact that all outcomes seem to decrease with age and that the hierarchy of outcomes doesn’t seem to change, suggests that older individuals are overall less likely to be stopped than younger individuals. Plus, the significant difference between the heights of the charts between males and females suggests that women are less likely to be stopped than men. Overall, this suggests that young male drivers, usually those aged around 25 years, are the most likely to be pulled over. This finding is consistent with what we have discussed in previous sections.
Secondly, the proportion of outcomes seems to be similar across ages and genders, but the chart has significant peaks at younger ages, particularly the late teens to early twenties. In this age range, “citation” is the most common outcome by a significant margin, suggesting that overall, younger individuals are the most likely to receive a citation as a result of a traffic stop. The difference between “citation” and “warning” is important to focus on, as it can reveal certain qualities of how officers treat and thereby perceive certain groups of people. In their paper analyzing a survey on public perception of police behavior, Carmichael, Helou, and Pereira (2021) find that reports of negative interactions with the police are most common among the youth compared to older age groups. They attribute this to a feeling of powerlessness among younger individuals, which leads them to perceive police behavior towards them as unjust and overly aggressive. The patterns shown in Figure 9 provide support for this intuition. The chart seems to reflect an unfair targeting of younger drivers when it comes to initiating a traffic stop and issuing a punishment. This provides perhaps just one manifestation of the predatory police practices towards the youth as outlined by Carmichael, Helou, and Pereira.
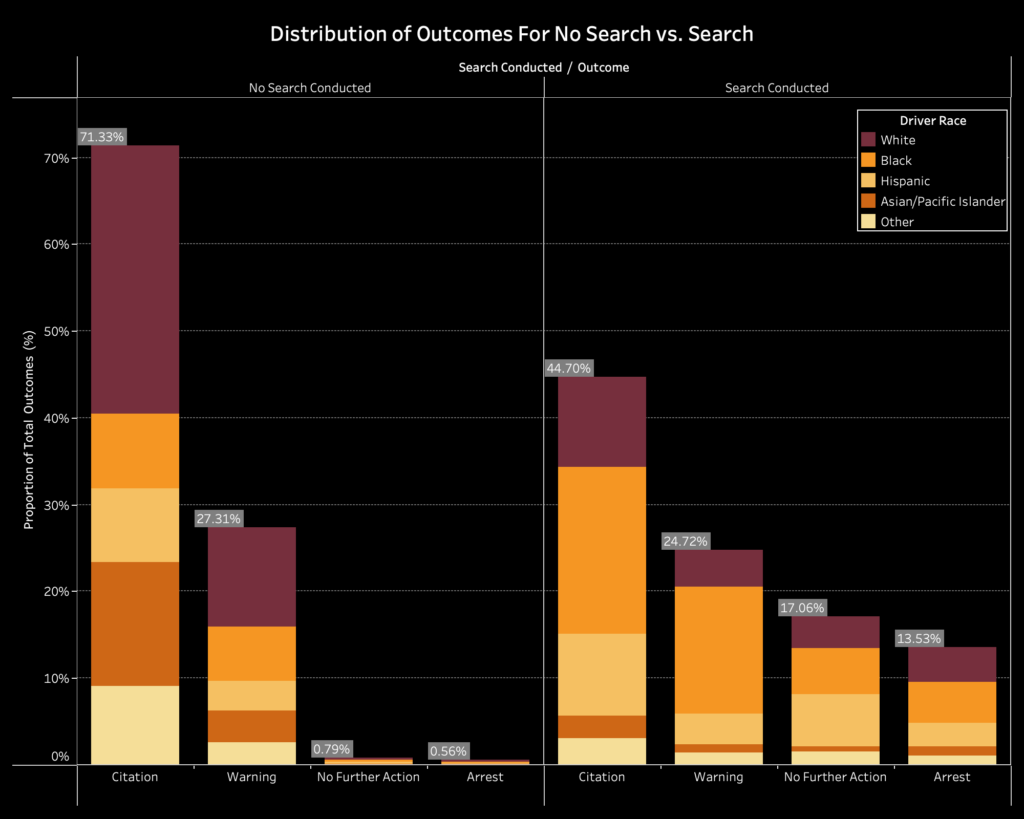
Figure 10: Proportion of Outcomes Based On Whether Or Not A Search Was Conducted. Made with Tableau.
We can further categorize the outcomes of traffic stops within one important variable: vehicle search. Each observation of our data was classified into whether or not the officer conducted a search on the driver’s vehicle before determining the outcome of the stop. Figure 10 juxtaposes the distribution of traffic stop outcomes between the event that a search was conducted and the event that a search was not conducted. Each outcome bar is divided into smaller sub-bars of varying colors, with each color representing a different driver race.
The chart reveals that for “no search conducted,” the most common outcome is “citation” by a large margin. The next most common outcome (“warning”) trails by about 44 percentage points. The other two outcomes (“arrest” and “no further action”) have a proportion of less than one percent, which follows the intuition that a driver is not likely to be arrested if their vehicle is not searched before. For both “citation” and “warning,” white drivers make up most of the proportion. The sheer sizes of the parts of each bar representing white drivers illustrate the fact that cases where a search was not conducted by police mostly involve white drivers. This is very evident in the “citation” bar, where we can see that for all cases with no search, about thirty percent of them involve a white driver who received a citation.
The distribution of outcomes for cases involving a vehicle search demonstrates a different finding. At first glance, we can notice that “arrest” and “no further action” now take up significantly greater proportions compared to the cases with no search. Again, this follows intuition. The sheer nature and context of a vehicle search indicate that arrest is a possible (and potentially more likely) outcome. Still, similar to cases where no search is conducted, “citation” is still the most common outcome, but by a significantly smaller margin this time. The second notable feature is the distribution of driver races within each bar. This time, Black drivers make up the majority for each outcome. This indicates that cases involving Black drivers make up the majority of traffic stops involving a vehicle search. Additionally, compared to cases where no search was conducted, Hispanic drivers now make up a much larger proportion of each bar.
These findings imply that Black and Hispanic drivers are the most likely to have their vehicle searched during a traffic stop compared to other races. This implication can potentially help us answer questions about SF police behavior towards certain races. Under the Fourth Amendment, a vehicle search is only permitted when an officer has “probable cause” or “reasonable suspicion” that the vehicle contains evidence of a crime. In most cases, the definition of this criteria is at the discretion of the officer conducting the traffic stop. Of course, we can not determine for certain what the officers saw just from our raw data. However, we can interpret this disparity of searches on Black and Hispanic drivers as a sign of distinct police bias against them. It is important to note that a vehicle search is much more likely to produce an arrest than if a search is not conducted. If we assume that each officer is aware of this fact when deciding to initiate a search, then we can suggest that police officers in San Francisco tend to carry out more aggressive policing practices toward Black and Hispanic individuals compared to white individuals, pointing toward the existence and influence of racial prejudice.
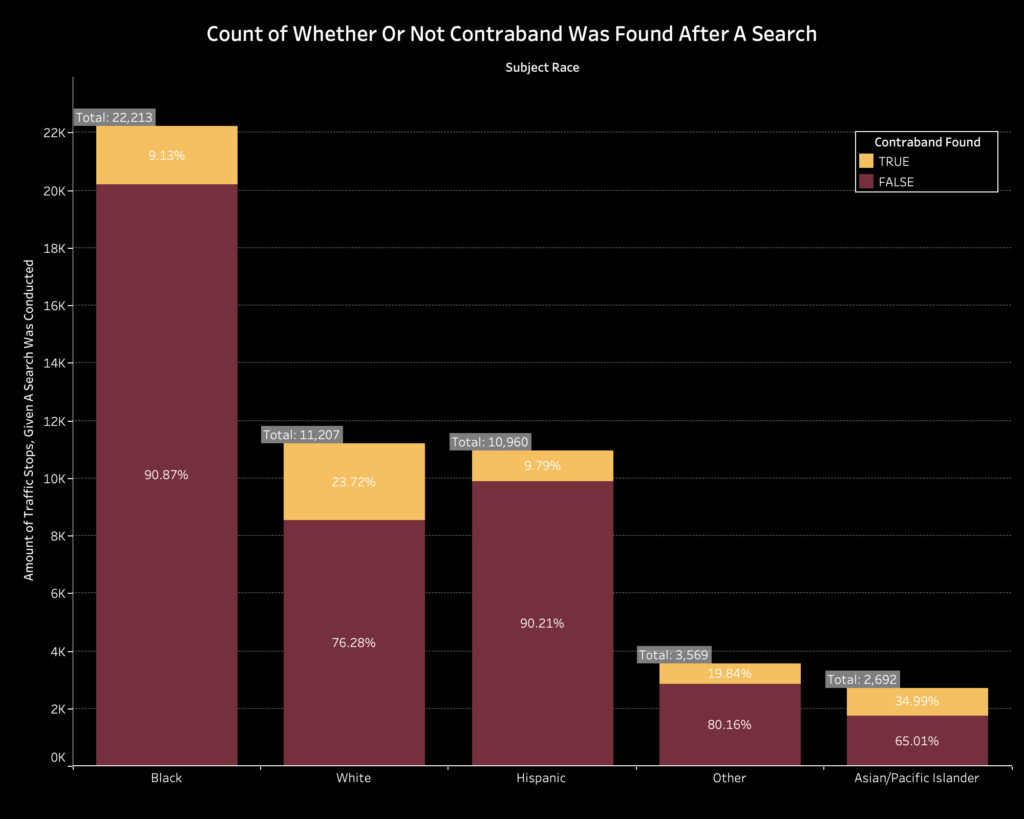
In order to fully extract the findings from the previous chart, it is important to take a closer look at the vehicle search cases and what outcomes they produced. Figure 11 plots the number of vehicle searches, with each bar representing a different driver race. Each bar is divided into two sections: whether or not contraband was found following the vehicle search. Each subsection is labeled with the proportion of the bar that it makes up. The variable “contraband found” was categorized into three possibilities: true, false, and no search. Figure 11 filters out this last possibility so the visualization only plots cases where a vehicle search was conducted. By plotting the “success” rates of searches, we can gauge whether or not the decision to conduct a search was justified, and determine what this reveals about how police officers in San Francisco treat each race.
There are several aspects of the chart that immediately stand out. For one, Black drivers have the highest number of searches by a significantly large margin. The number of searches for Black drivers is almost double that of white drivers, despite the fact that white drivers are pulled over the most (a finding we discussed in the previous sections). This finding gains further insight when we also compare the search success rates. Black and Hispanic drivers have the lowest contraband discovery rates at 9.13% and 9.79% respectively. White drivers, who have a number of vehicle searches much lower than Black drivers and only slightly above Hispanic drivers, have a much higher discovery rate at 23.72%.
What do these features say about the role of prejudice in policing? In the analysis of Figure 10, we explored how the decision to conduct a search is largely at the discretion of the officer, who does not necessarily have to adhere to an objective definition of “probable cause” or “reasonable suspicion.” The above findings from the chart raise concerns over whether this loose criteria is being applied equitable across driver races. The significantly large count of searches for Black drivers compared to other races suggests that officers are much more likely to conduct a search on a Black driver compared to other races. This suggests a heightened suspicion toward Black individuals among police officers, pointing toward the presence of racial prejudice among officers in San Francisco. Additionally, we can interpret the “success” rates of the searches as an indication of whether or not the search was actually justified. The fact that Black and Hispanic drivers have the lowest search success rates implies that officers use weaker justification when deciding to search Black and Hispanic drivers.
In general, the fact that contraband discovery rates make up a minority of all search cases signifies that the policy of “probable cause” and “reasonable suspicion” is flawed and perpetuates aggressive policing practices. This policy also gives way to real-life acts of racist prejudices by authority figures against ordinary citizens. These problems hold important insights for our policing system overall. In particular, it raises concerns about the fairness of law enforcement and how that could affect the fears and lives of ordinary people. In their paper exploring how big data can influence police accountability, authors Sharad Goel, Maya Perelman, Ravi Shroff, and David Alan Sklansky provide a perspective on how we can improve law enforcement policy. They focus on stop-and-frisk practices in New York City, which, similar to the vehicle search practices in San Francisco, reflect unfair targeting of Black and Hispanic individuals. Additionally, the authors find that many factors that officers consider when deciding to initiate a search are actually very unsuccessful in correctly identifying suspects with contraband. Overall, the authors’ main objective of the paper is to suggest how law enforcement agencies can use data analysis to improve upon their policies to make them fairer and reduce racial discrimination. Data analysis helps to visualize what kinds of stops and searches are successful, particularly based on suspect race and geographic location, and agencies can use these findings to give specific instructions to their officers. Our own data and visualization show that SF police officers unfairly treat Black and Hispanic drivers. Implementing tools that improve awareness and accountability within police forces can potentially mitigate these discriminatory practices.
Our analysis of the outcomes of traffic stops reveals that younger individuals, Black drivers, and Hispanic drivers are disproportionately targeted and treated unfairly by police officers. The data visualizations show that Black drivers are disproportionately subjected to vehicle searches, an instance where arrest is much more likely. Both Black and Hispanic drivers have the lowest contraband discovery rates in cases where their vehicle is searched, indicating that officers use weaker justification to initiate searches on them. Overall, these findings demonstrate that law enforcement policies regarding traffic stops, such as “probable cause” and other search criteria, allow police officers to perpetrate discriminatory practices. Becoming aware of these prejudices through data and holding police forces accountable can pave the way for meaningful policy change. These changes can make law enforcement more just.
OVER TIME, STOPS DECREASED, BUT BLACK DRIVERS BECAME A LARGER PROPORTION OF ARRESTS AFTER STOPS.
Our data set covered traffic stops across almost a decade. It is safe to assume that policing practices have changed dramatically during a time period that vast. The inequities we have studied thus far have been drawn from that entire time frame. This section aims to uncover how police practices differ across years, and how they changed from the beginning of our time frame to the end. By examining these differences and positioning them alongside our understanding of how social dynamics have changed over time, we can infer how certain prejudices have played a role in policing over time, and what the trajectory of future policing could look like.
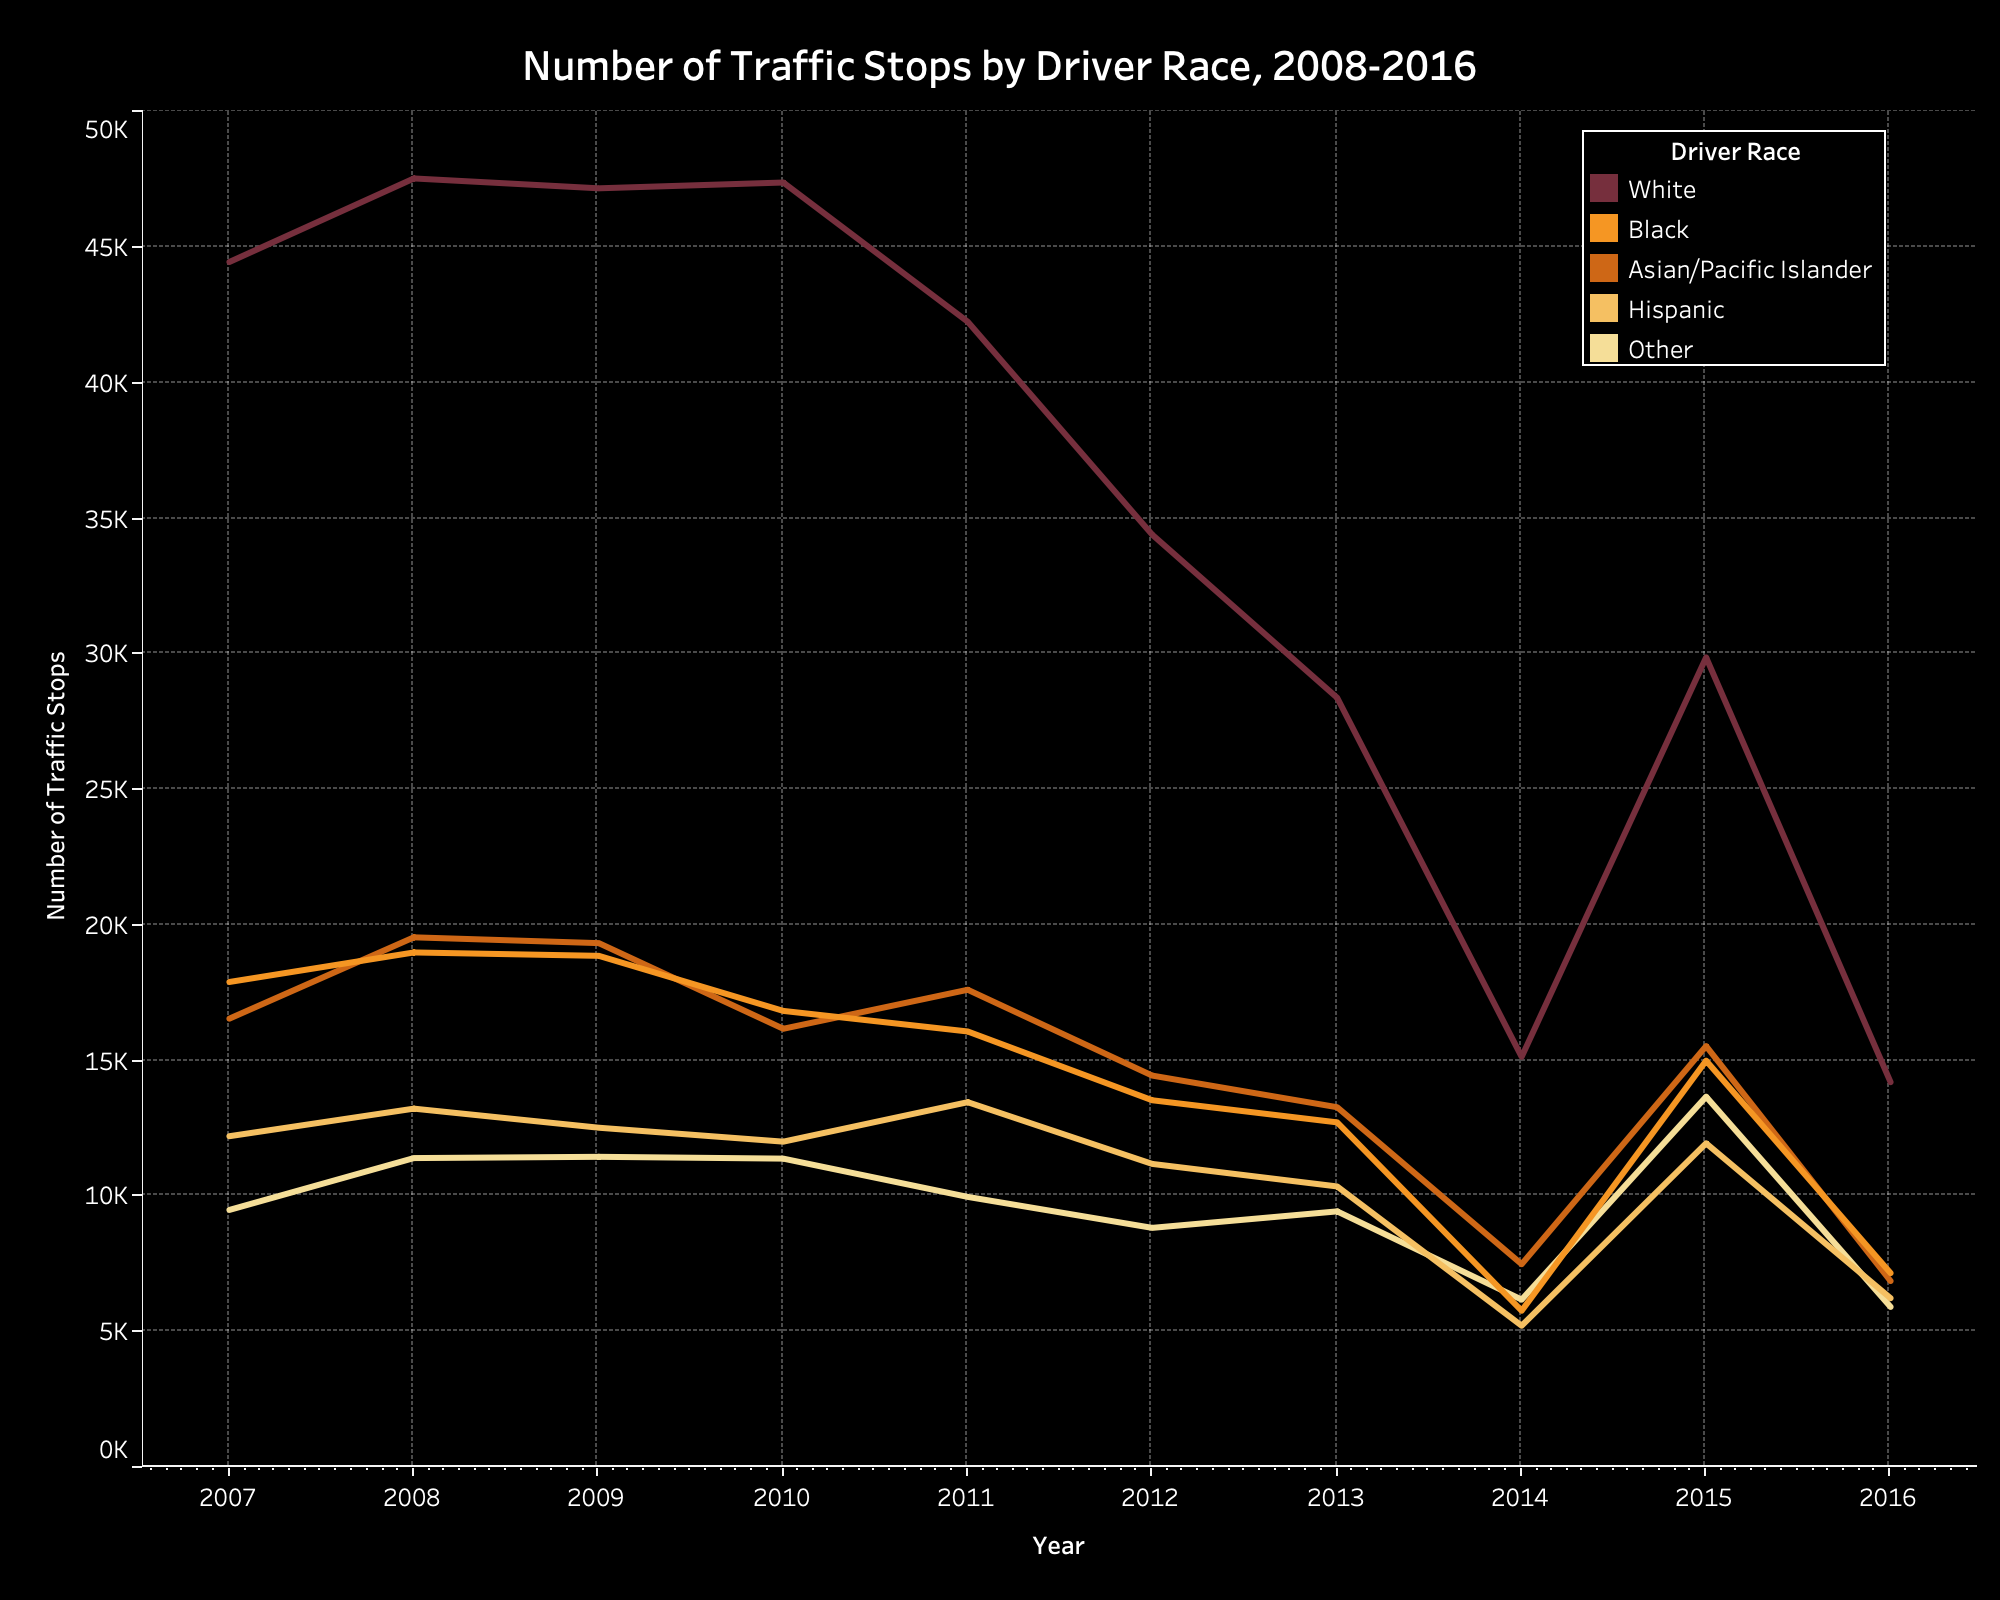
Figure 12 shows the number of traffic stops per driver race for each year from 2007 to 2016. Each line, distinguished by a different color, represents a different driver race. The shape of the lines illustrates how the number of traffic stops has fluctuated over time.
The first thing to note is the general trend of traffic stop amounts over time. For all races, the line follows a downward trend. There is a notable spike in stop counts in 2015, but in 2016, the number dropped below the amount before the spike, continuing the downward trend. This suggests that from 2007 to 2016, police officers in San Francisco performed fewer traffic stops over the years. This finding applies to all driver races. The reason for the spike in 2015 is difficult to uncover. As explained in our timeline, Ordinance #116-15, which was passed in November 2015, required officers in San Francisco to improve their reporting of traffic stop data. However, given that this rule was passed late into 2015, and did not mandate retroactive revision of stops conducted before that data, it is unlikely that this was the main driving force behind the significant increase in traffic stops. Still, disregarding this peculiar spike, we can note the overall decline in traffic stops over time as a sign of less active or aggressive policing practices over time.
The order of traffic stop counts between races stayed consistent from 2007 to 2016. White drivers retain the highest count across all years by a significant margin. The other races see several fluctuations in order over time. However, comparing the very beginning and very end of the time period, the order remains the same: Black, Asian/Pacific Islander, Hispanic, then other. It is important to consider that the decision to initiate a traffic stop is likely not reliant on the driver’s race. As discussed before, Pierson suggests a “veil of darkness” theory that could explain this pattern in traffic stop count. The theory suggests that especially during the times of day when it is dark outside, minority drivers are less likely to be targeted and pulled over by police because the darkness shrouds their identity. This theory could explain why white drivers are the most likely to be pulled over. White people make up the largest proportion of San Francisco’s racial demographic, so if we assume that police officers are pulling over drivers without knowing their identity, it makes sense that white drivers would be the most likely to be pulled over across all years.
Given this context, if we want to find insights into specific discriminatory police practices over time, it would be more appropriate to look at how outcomes have shifted over time, specifically arrests.
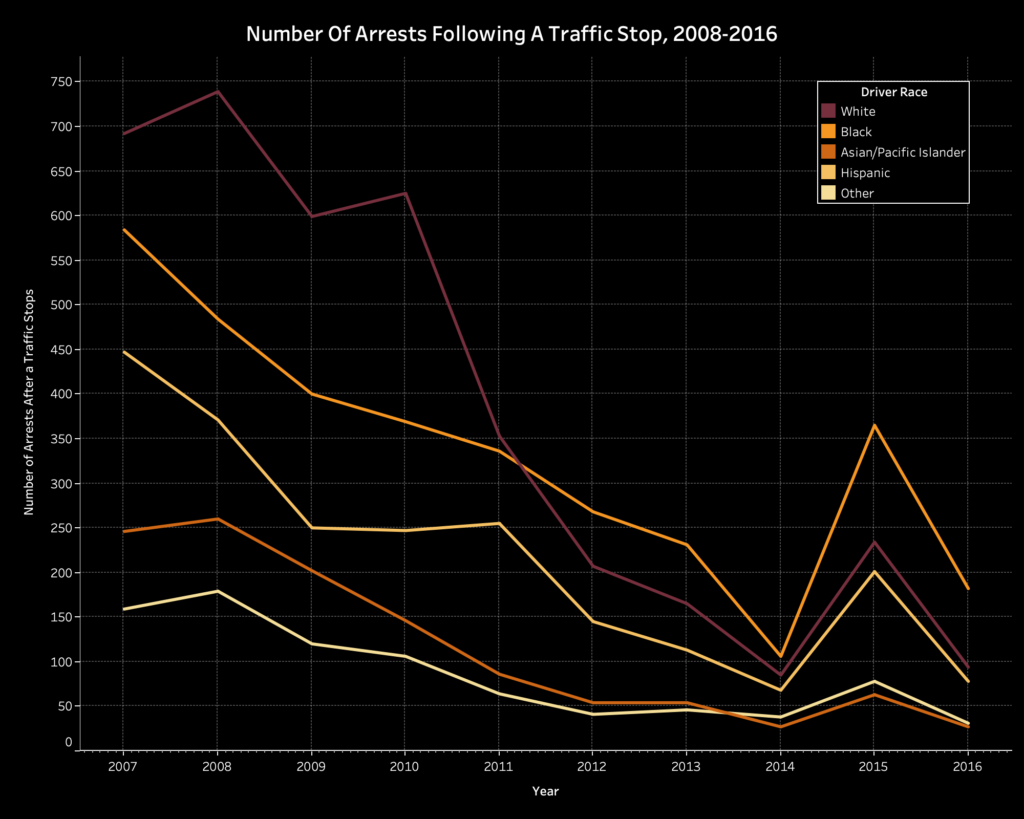
Figure 13 plots the number of arrests following a traffic stop between races from 2007 to 2016. Similar to Figure 12, the chart displays a general decrease in arrests over time. However, it displays a change in order that is unlike that seen in Figure 12. White drivers started in first place, but since in 2012, Black drivers became the most commonly arrested group. They stay in this spot for the remainder of the chart.
While the number of stops does not seem to reflect a specific disparity in police behavior, the number of arrests certainly does. Despite the fact that white drivers were the most likely to be stopped for the whole time period, Black drivers became the most likely to be arrested beginning in 2012. This clear disparity in stop outcomes suggests the growing presence of prejudice among police over time. As we saw in previous sections, Black drivers were subjected to the most scrutiny by police officers. Figure 13 supports this finding. If we view searches and arrests as more “aggressive” police practices, then we can say that police prejudice towards minorities, especially Black drivers, has increased over time, despite the fact that overall traffic stops and searches have decreased over time.
In a paper studying the history of Supreme Court decisions, David A. Harris examines how discriminatory practices among police officers are enabled by certain policies passed by the U.S. government. He focuses on the decision of Whren v. United States, which ruled that police officers can stop a vehicle as long as they have reasonable cause to do so. Harris argues that despite the Fourth Amendment establishing restraints on the power of police officers, Whren was considered an exception because of the context of the war on drugs. Overall, he emphasizes that even if certain constitutional laws provide safeguards against police power, exceptions can always be made to justify discriminatory practices towards minorities. This exposes a major flaw in the structure of our law enforcement systems and aligns with our finding that more awareness and accountability towards police officers can help mitigate unjust policing practices. If we dismantle certain policies allowing for these practices to be perpetrated and instead implement more means of analyzing stop data, we can make law enforcement more equitable.
This reveals the importance of remaining aware of police practices and passing certain legislation to directly address it. In particular, yearly trends in stop data reveal that over time, the number of stops has decreased, but Black drivers grew in the proportion of those being arrested after stops. The presence of this inequity illustrates that careful analysis of the practices of law enforcement is necessary to make meaningful change. Instead of moving toward a less equitable future, as the trajectory in the charts suggest, we must work to enact policies that prevent the influence of prejudice in policing.
CONCLUSION
We cannot assess our conclusions without revisiting our initial questions:
What do the frequency and outcomes of traffic stops reveal about police behavior and prejudices in San Francisco?
What factors have shaped current patterns of policing in San Francisco?
What are the common outcomes of police stops, and how do these outcomes differ across race, age, or gender?
Our data and sources helped us answer these questions, but the conclusions we came to were difficult to accept. Policing as a practice is created to facilitate safety and justice for all, but our analysis suggests that significant discrepancies exist based on race, gender, age, and location. Although white men lead the aggregate count in most categories, our data shows
- People of color are disproportionally searched and arrested, particularly young Black and Hispanic male individuals
- Older individuals are significantly less likely to be stopped
- Locations with significant non-white population density are more frequently stopped.
- Significantly fewer female individuals than male individuals stopped
These conclusions, while concerning, are not valuable on their own. Indeed, they provide additional evidence to increasing calls for fair policing, better training for police officers, or rethinking the profession as a whole, but our data reflects the lives of real people. Every stop represents an important event in someone’s life that could be a harmless, helpful, or potentially life-changing situation in the event of citations or arrests. Police officers and agencies have a difficult, high-pressure, and often thankless role in our society, but these findings are unacceptable and add to the growing need for legislation and active mitigation efforts in pursuit of a fairer and more just society.